You have a bolt, a torque wrench, and a chart taped to the workshop wall. The chart says 50 Nm. You pull to 50 Nm, hear the click, and move on.
But did you just clamp that joint correctly? Maybe. Or maybe you stretched the bolt close to its limit, or left it far too loose. The number on the wall is the same either way. What changed is everything the chart didn’t tell you.
A good bolt torque chart is genuinely useful. It saves time, and it beats tightening by feel. But a chart is only a shortcut for a calculation, and that calculation depends on assumptions. If your bolt doesn’t match those assumptions, the number can mislead you.
This guide gives you a bolt torque chart for the common metric sizes (M6 to M16) in grades 8.8, 10.9 and 12.9. More importantly, it shows you where every number comes from, so you can judge when to trust it and when to adjust.
What a bolt torque chart tells you (and what it doesn’t)
A bolt torque chart lists the twisting force, in newton-metres (Nm) or foot-pounds (ft-lb), to apply to a bolt of a given size and strength grade.
The goal of tightening is never torque itself. The goal is clamping force, also called preload. A tightened bolt works like a very stiff spring. It stretches slightly and pulls the joint together. That pull is what stops the joint from slipping, leaking or loosening under vibration.
Torque is only an indirect way to get there. Most of the effort you put into the wrench goes into fighting friction under the bolt head and in the threads. Only a small part becomes stretch in the bolt. So two bolts tightened to the same torque can end up with quite different clamping forces if their friction is different.
Here is something many charts don’t mention. The international standard for bolt strength, ISO 898-1, defines the mechanical properties of steel bolts, such as tensile strength and proof load. It does not set tightening torque values itself. You can see what it covers on the official ISO 898-1:2013 page. Every torque chart you find is therefore a derived table: someone took the strength data from the standard and applied a friction assumption. Different assumptions give different charts, which is why you will see two charts disagree for the same bolt.
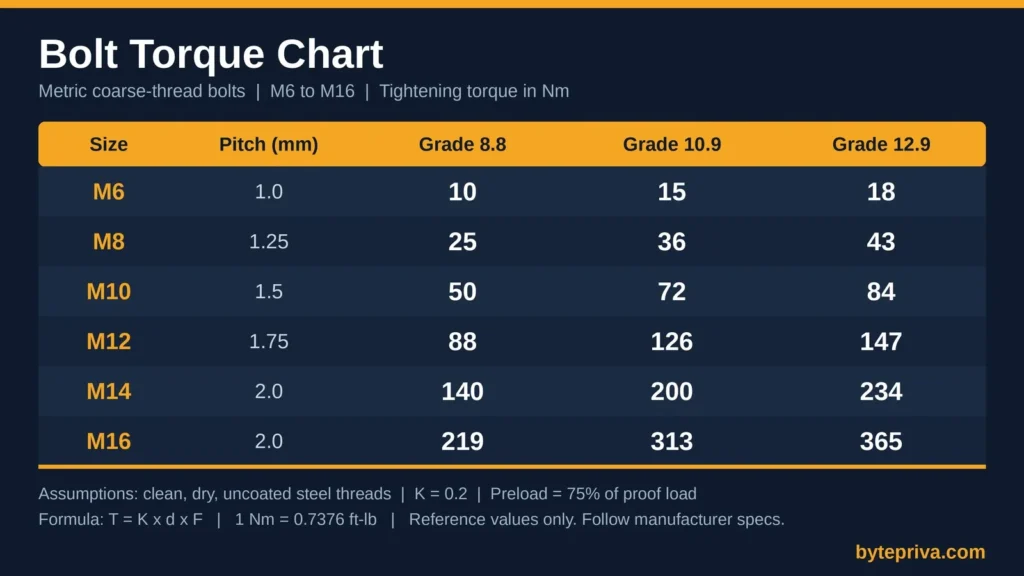
Bolt torque chart: M6 to M16 (Nm)
These values are for clean, dry, uncoated steel threads on coarse-pitch metric bolts. The target preload is 75% of the bolt’s proof load, and the friction (nut) factor is K = 0.2. All three of those assumptions are explained in the next section.
| Size | Pitch (mm) | Stress area (mm²) | Grade 8.8 (Nm) | Grade 10.9 (Nm) | Grade 12.9 (Nm) |
|---|---|---|---|---|---|
| M6 | 1.0 | 20.1 | 10 | 15 | 18 |
| M8 | 1.25 | 36.6 | 25 | 36 | 43 |
| M10 | 1.5 | 58.0 | 50 | 72 | 84 |
| M12 | 1.75 | 84.3 | 88 | 126 | 147 |
| M14 | 2.0 | 115 | 140 | 200 | 234 |
| M16 | 2.0 | 157 | 219 | 313 | 365 |
Prefer foot-pounds? Multiply newton-metres by 0.7376. Here is the same chart converted:
| Size | Grade 8.8 (ft-lb) | Grade 10.9 (ft-lb) | Grade 12.9 (ft-lb) |
|---|---|---|---|
| M6 | 7.4 | 11.1 | 13.3 |
| M8 | 18.4 | 26.6 | 31.7 |
| M10 | 36.9 | 53.1 | 62.0 |
| M12 | 64.9 | 92.9 | 108.4 |
| M14 | 103.3 | 147.5 | 172.6 |
| M16 | 161.5 | 230.8 | 269.2 |
Why does this chart stop at M16? Because the proof stress figure for grade 8.8 is clearly defined up to that size, and I would rather give you fewer numbers you can trust than a longer table with shaky ones. For anything larger, use the formula in the next section or your fastener supplier’s data.
What this chart is not for: fine-pitch threads, stainless bolts, bolts without a visible grade marking, and any joint where a failure could hurt someone. More on that below.
How to use the chart in three steps
Step 1: Read the grade on the bolt head. Metric bolts are normally stamped with their property class, such as 8.8, 10.9 or 12.9. The first number relates to tensile strength and the second to the yield-to-tensile ratio. A higher grade means a stronger bolt, which can safely carry more preload, so it takes more torque. If the head has no marking, do not guess. Treat it as an unknown low-grade bolt and look for a specification from whoever supplied it.
Step 2: Find the size and the grade column. The size (M10, M12 and so on) is the nominal diameter in millimetres. Match it to the row, then read across to your grade.
Step 3: Ask whether the threads match the chart’s assumption. This is the step most people skip. The chart assumes dry, clean threads. If the bolt is oiled, greased, plated, rusty or coated, the right torque is different. The next sections show you how to adjust.
Where the numbers come from: the torque formula
The relationship behind every bolt torque chart is short:
T = K × d × F
- T is the tightening torque (N·m)
- K is the nut factor, a number that bundles up all the friction in the joint
- d is the nominal bolt diameter (in metres)
- F is the clamping force you want (in newtons)
To find F, we start from the bolt’s proof load. Proof load is the force a bolt can carry and still return to its original length after the load is removed. It equals the bolt’s stress area multiplied by its proof stress:
Proof load = stress area × proof stress
In ISO 898-1, the nominal proof stress is 580 MPa for grade 8.8 (up to M16), 830 MPa for grade 10.9 and 970 MPa for grade 12.9. A very common practice for reusable joints is to aim for about 75% of proof load as the target preload. That leaves a safety margin below the point where the bolt starts to yield.
Let’s rebuild one number from the chart so you can see it isn’t magic.
Worked example 1: M10 grade 8.8, dry threads
- Stress area of an M10 coarse thread: 58 mm²
- Proof load: 58 × 580 = 33,640 N
- Target preload (75%): 0.75 × 33,640 = 25,230 N
- Torque: T = 0.2 × 0.010 × 25,230 = 50.5 Nm
That rounds to the 50 Nm in the chart. Every other cell in the table was built the same way.
Why lubrication changes everything
Look at the formula again. Torque is directly proportional to K. If friction drops, K drops, and the same torque produces much more clamping force.
Take that same M10 grade 8.8 bolt, but now the threads are lightly oiled. A commonly used K for that condition is around 0.15. Treat that as an illustration, not a guarantee, because real K values depend on the oil, the surfaces and the finish.
Worked example 2: the same M10 bolt, oiled
To reach the same 25,230 N of preload, you need:
T = 0.15 × 0.010 × 25,230 = 37.8 Nm
So the correct torque for an oiled bolt is about three-quarters of the dry value.
Worked example 3: what happens if you ignore it
Now suppose you tighten that oiled bolt to the chart’s dry value of 50 Nm. The preload you actually get is:
F = T ÷ (K × d) = 50 ÷ (0.15 × 0.010) = 33,333 N
Compare that to the M10 grade 8.8 proof load of 33,640 N. You’ve pushed the bolt to about 99% of its proof load, when you were aiming for 75%. There is almost no margin left. One extra pull on the wrench, or a slightly different friction condition, and the bolt can start to yield.
The wrench clicked at exactly the same number in both cases. The result was completely different. This is the single most useful idea in this whole article: a torque value is only correct for the friction condition it was calculated for.
The reverse problem exists too. Rough, dirty, rusty or heavily coated threads can have a higher K. The same torque then delivers less clamping force than the chart suggests, and the joint may end up looser than you think.
Common mistakes that make a bolt torque chart wrong
Using a dry-thread chart on lubricated bolts. As shown above, this is the classic way to over-tighten a bolt without realising it.
Mixing up grades. An 8.8 bolt tightened to a 12.9 value is overloaded. A 12.9 bolt tightened to an 8.8 value is simply under-clamped. Always read the head marking first.
Using the coarse-thread chart on fine-pitch bolts. Fine threads have a different stress area and different geometry. The table here is for coarse pitch only.
Trusting a chart that doesn’t state its assumptions. If a chart doesn’t tell you its K value and its percentage of proof load, you can’t know whether it fits your bolt. Two honest charts for the same bolt can differ by a lot, simply because one assumes a lower K or a different preload target.
Treating “max torque” as “right torque.” Some charts list maximum values. Going to the maximum every time leaves you no margin for friction variation.
Reusing damaged bolts. A bolt that has already been stretched past its yield no longer behaves like the table says. If a bolt was over-tightened, replace it rather than trying to correct it by re-torquing.
Torque wrench habits that improve accuracy
Even the right number is wasted if the tool or technique is off.
- Use the right wrench for the job. Most torque wrenches are more reliable in the middle of their range than at the very bottom or top. Using a large wrench for a small bolt is a common source of error.
- Pull smoothly. Jerking the handle makes the reading less repeatable. With a click-type wrench, stop as soon as it clicks.
- Keep the wrench calibrated. Follow the maker’s calibration schedule, and don’t drop it.
- Clean the threads first. Dirt and old thread-locker change friction, and friction is the whole game.
- Tighten in stages for multi-bolt joints. For flanges and covers, work in a cross pattern and in two or three passes rather than fully tightening one bolt at a time. This helps the joint close evenly.
- Don’t add an extension that changes the lever arm. An in-line extension is fine, but an offset one changes the effective torque.
When not to use a generic bolt torque chart
A general chart is a good starting point for workshop jobs, light fabrication and machinery where no other specification exists. It is the wrong source in these situations:
- Anything safety-critical. Lifting equipment, pressure systems, vehicle suspension and brakes, and structural connections all have specified procedures. Follow the manufacturer’s or the engineer’s instructions, not a general table.
- Engine and gasket joints. Many of these use specific tightening sequences, and some use angle-based methods. Use the service manual.
- Stainless steel bolts. They have different strength properties and a tendency to seize (gall), so they need their own values and usually a lubricant.
- Bolts into soft materials. Aluminium, plastics and thin sheet can strip long before the bolt reaches its preload.
- Fine-pitch and special fasteners. Use the supplier’s data.
If a manufacturer gives you a torque value for a specific joint, that value always wins over any chart, including this one.
Frequently asked questions
What is the torque for an M10 bolt, grade 8.8?
For clean, dry threads, the chart value is about 50 Nm (roughly 37 ft-lb), based on 75% of proof load and K = 0.2. If the threads are lightly oiled, the same preload needs less torque, about 38 Nm with the example K of 0.15.
What is the torque for an M8 bolt, grade 8.8?
About 25 Nm (roughly 18 ft-lb) for clean, dry threads under the same assumptions.
What is the torque for an M12 bolt, grade 10.9?
About 126 Nm (roughly 93 ft-lb) for clean, dry threads under the same assumptions.
Does the torque change if the bolt is oiled or greased?
Yes. Lubrication lowers friction, so less torque is needed to reach the same clamping force. Applying the dry value to a lubricated bolt can over-tighten it.
Is a higher bolt grade always better?
Not automatically. A higher grade can carry more preload, but it needs a higher torque to realise that strength, and it may be less forgiving in some situations. Use the grade the joint was designed for.
Why do different bolt torque charts show different numbers?
Because they use different assumptions: a different K value, a different percentage of proof load, or a different thread condition. The strength data comes from the standard, but the torque values are calculated by whoever makes the chart.
Final thoughts
A bolt torque chart is a tool, not a guarantee. The numbers above are solid for what they describe: clean, dry, coarse-thread steel bolts tightened to 75% of proof load. Change the friction, and the right number changes with it.
If you remember one thing, make it the formula, T = K × d × F. Once you understand it, you can adjust any chart to match your real conditions instead of trusting a number blindly.
Disclaimer
The values in this article are general reference figures calculated under the stated assumptions. They are provided for information only and are not a substitute for manufacturer specifications, engineering calculations or professional judgement. For safety-critical, structural, lifting, pressure or vehicle applications, always follow the specified procedure for that equipment. Values were reviewed in October 2026, and the underlying ISO 898-1 standard may be revised in future.
Want to skip the manual maths? You can enter your bolt size, grade and thread condition into the free Bolt Torque Calculator and get the result instantly.